
What is quantitative research? In the current information landscape, it is important to know the answer. Quantitative research is one of the two major research types to exist. And so, in this article, we will go through the details on what exactly the term means, how it works, and where to apply it in the business environment.
What is quantitative research?
The answer to “what is quantitative research” can be derived from the name itself. It is focused on quantifying data – expressing and analyzing it via specific values and units. Simply put, it is the type of research that focuses on numbers and everything that can be described using numbers, fractions and percentages. This is to distinguish it from qualitative research, which deals with text based data that can’t easily be turned into numbers.
Quantitative research answers questions such as “how much” or “how often”. Number of units sold, money flows or customer count are all examples of quantitative data. This doesn’t only apply to data that was numerical in the beginning, though. It is possible to quantify many things. For example, by asking a user to rate their experience “on a scale of one to ten” and then analyzing the reply trend, you are also performing quantitative research.
What are the main features of quantitative research?
Quantitative research has a few key features:
- Numerical data
As described earlier, it deals strictly with data that can be expressed via numbers, statistical values or percentages. - Structured data collection
To collect reliable numeric data, it needs to be done in a set manner. This is why quantitative research usually thoroughly plans its data collection methods. These can be surveys, or questionnaires, or an experiment with clearly defined parameters. You can’t be making changes on a whim, such as adding new survey questions in the middle of the research – this would render the data unreliable.
- Objectivity
While you can still interpret the results, the numerical data itself can only be read one way. Three plus three still equals six under any circumstances. Once you have collected the data, you have no influence anymore over what is the sum, what is the median or the highest number. Using the standardized approach helps eliminate the researcher’s own influence and provide objective insights.
- Replicability
It is always possible to repeat the research using the same study design. If you use new data with the old design and get the same or similar results, this helps ensure the results are reliable. And if, after a while, the results change, this can still be useful to track the shifts and new developments in the trend.
- Large sample sizes
While sometimes excluded, large sample sizes are also one of the important features of quantitative research. Asking two people will only tell you what they think. But ask two hundred people the same question, and you can determine a statistical trend. Bigger sample sizes are preferred in quantitative research.
Main methods of quantitative research
The main methods, to provide understanding of what is quantitative research like, can be categorized into:
- Descriptive research – measures data and presents findings without changing anything, essentially just “describing” the situation;
- Correlational research – looks into the way several things or factors may be influencing one another, the ties and correlations between them;
- Experimental research – tests a hypothesis by measuring how changing a singular factor/factors changes the result. Usually uses control and experimental groups, to make sure there is an easy way to compare the situation with and without the intervention. For example, an A/B test in marketing can be seen as experimental;
- Quasi-experimental research – similarly to experimental, it studies how a change to one factor can affect the rest. The difference is that it does not use randomized control and experimental groups. Instead, groups are formed based on a specific factor. There is also less control over the factors other than the main subject of the study. This can be used in researching, for example, naturally occurring phenomena where controlling every single factor is impossible, or in the situation where fully randomized groups may be unethical, such as in medical research.
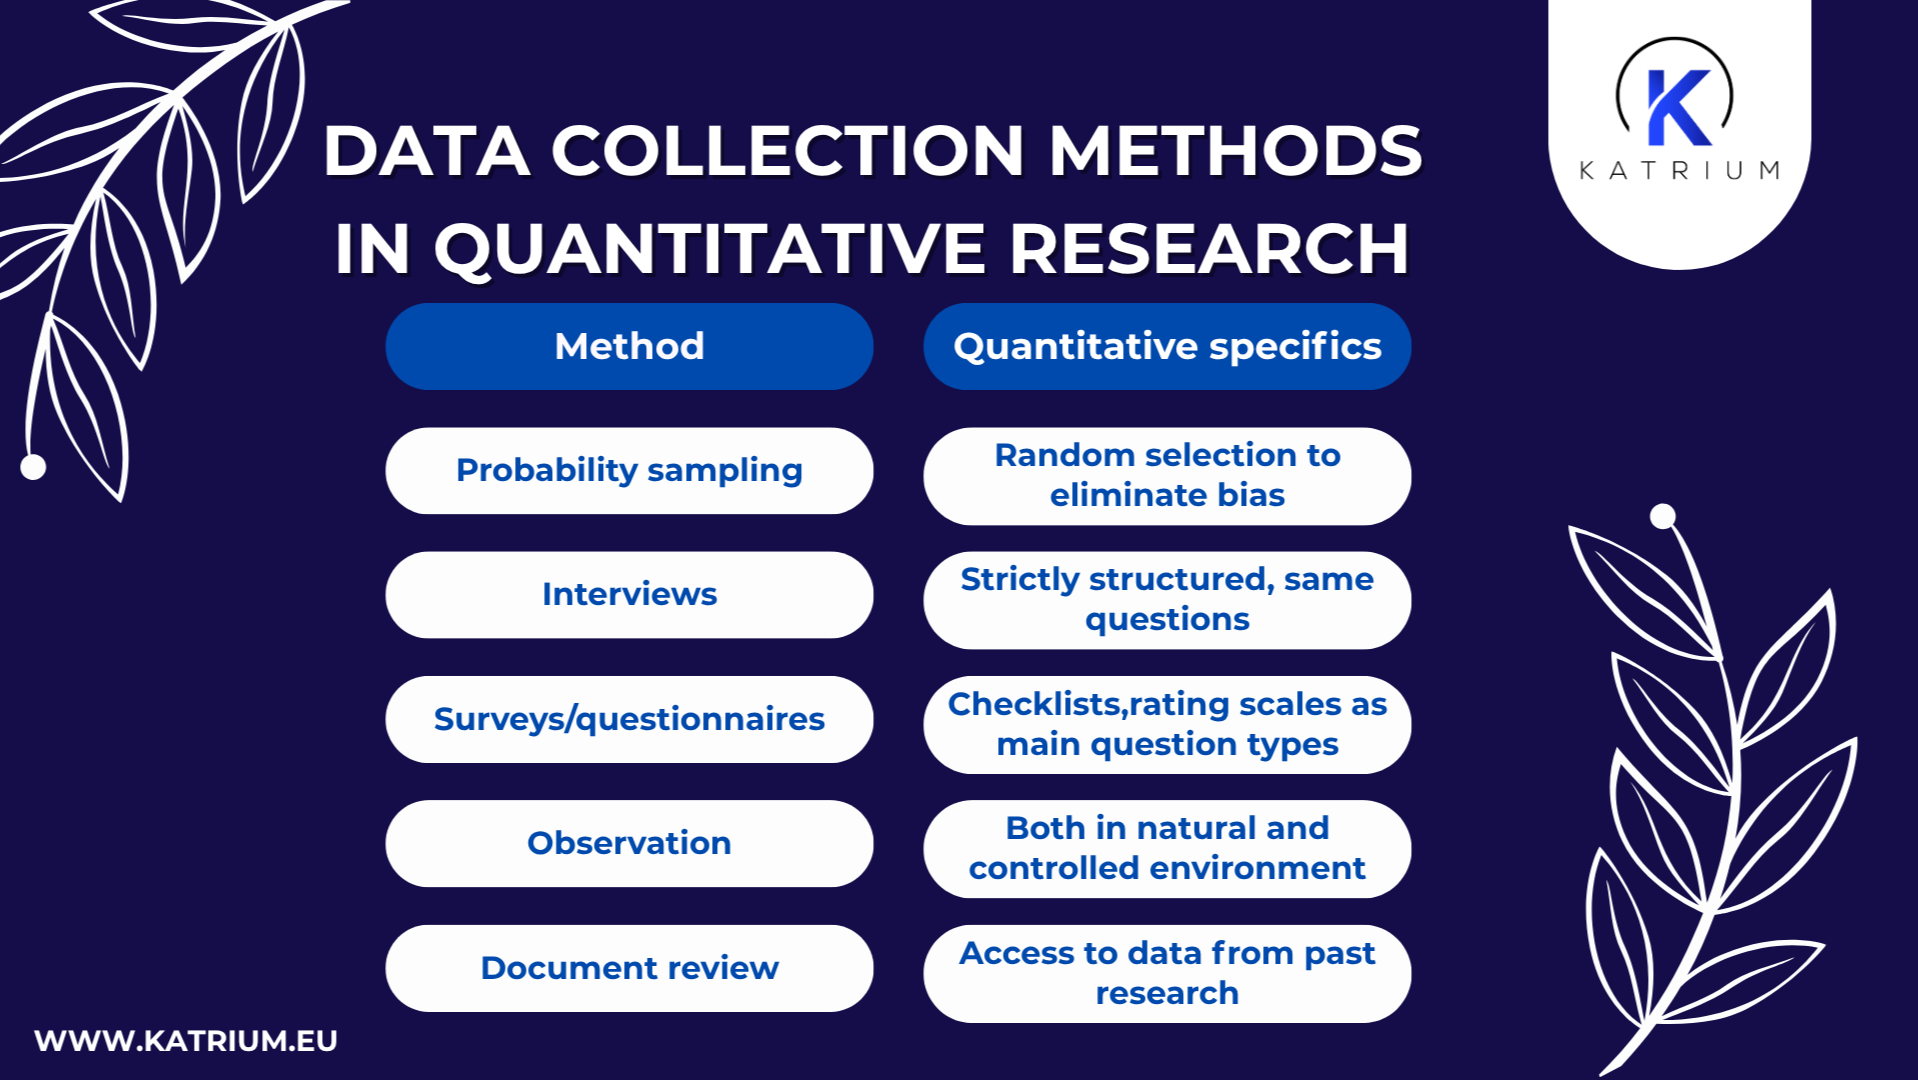
The main data collection methods used in quantitative research are probability sampling, surveys and questionnaires, observations, interviews and review of existing documents. Many of these methods are present in qualitative research as well – the difference is in the questions posed and data collected. For example, a questionnaire may include open questions where you have to analyze the individual responses (qualitative data) as well as single choice/multiple choice questions, where what matters is how many people have picked an option (quantitative data).
In business environment, these methods can be applied, for example, when your goal is:
- To identify market trends;
- To form a hypothesis and test it later;
- To research the characteristics of a specific sample group and form a clear picture;
- To confirm if an existing phenomenon is still occurring.
Pros and cons of quantitative research
The main strengths of quantitative research are its reliability and objectivity, scalability, analyzability and predictiveness. Let’s dive deeper in what these terms mean:
Reliability and objectivity – as discussed earlier, numerical data and standardized approaches make the answers to the question exact and precise. It attempts to eliminate the subjective bias as much as possible, giving only evidence-supported answers.

Scalability – once you have your data collection method finalized, it is possible to scale easily. For example, a survey can be sent to fifty, a hundred, or thousands of people without needing to be rewritten, and the data will be collected the same way.
Analyzability – mathematics-based data makes it easier to apply statistical methods, and it is a lot easier to work with using machine methods than, say, text data. Once the data is collected, building graphs, charts and calculating statistical values becomes quick and simple. Katrium’s experts have prepared an article for you to learn more specifically about analysis of research data.
Predictiveness – statistics and pattern determination can be used to support predictive decision-making and can help the company act quicker. If you know that ice cream sales are statistically correlated with heat, then, as soon as you hear about an upcoming heatwave, you can stock up on ice cream. A simple example, but these predictions can go a lot deeper.
While these are its core strengths, quantitative research has its weaknesses as well.
- Reliance on proper preparation – your answers are only ever as good as your questions are. This is why preparation is crucial for quantitative research. Faulty questions, such as unclear or biased ones, influence the results and make them less representative of reality. At Katrium, we know how to get the most out of surveys – book a meeting with us if you need help!
- Limited depth and flexibility – in many situations, context is important for full understanding. However, now that “what is quantitative research” has been answered, it is clear that it can’t take all of the details into account. That’s simply because not everything is quantifiable. Quantitative research gives you answers to “how much”, “how often” or “to what degree”, but it can’t tell you “why”.
- Possible high costs – depending on the method you’re using, reaching the required number of participants can be expensive. Analyzing huge amounts of data may require better software and equipment. And preparing precise questionnaires or experiment settings needs qualified staff. These are not always going to be a factor depending on the scale and specifics of your study, but it’s still worth keeping in mind.
What is quantitative research: Conclusion
Hopefully, by now you have a good answer to the question of “what is quantitative research”. Applying it to business environment, you can use it to gather evidence-based data on subjects such as these:
- Are people interested in your product or service? How big is the potential market?
- What kind of people are your prospective customers? How can you characterize them as buyers?
- What are the top-performing products?
- How is the market changing? What are the current trends?
- How are the visitors behaving on your website? How long do they spend on a page?
- Which of the ad campaigns is more effective at generating new followers? Or more sales? How would it change if you adjusted one aspect?
These are just some examples of what quantitative research can do for you. At Katrium, we can provide you with expert help to fully leverage the advantages this type of research can bring. Contact us and get the data you need to help your business flourish!