
How do you analyze market research data to actually help a company develop more? Collecting customer and competitor feedback is a vital initial step that businesses should take. But raw information alone will not help them grow. Businesses often devote an excessive amount of time to gathering industry statistics and interviews, plus customer survey results. Yet, internal teams lack the time they need to sort and filter through messy spreadsheets. So they often miss the key points. After all, the only realistic way for them to interpret what their customers need, what their competitors are doing, and what strategic actions need to be taken is to analyze market research data and ultimately turn those raw numbers into more readable insights.
How Do You Analyze Market Research Data? Start by Cleaning It
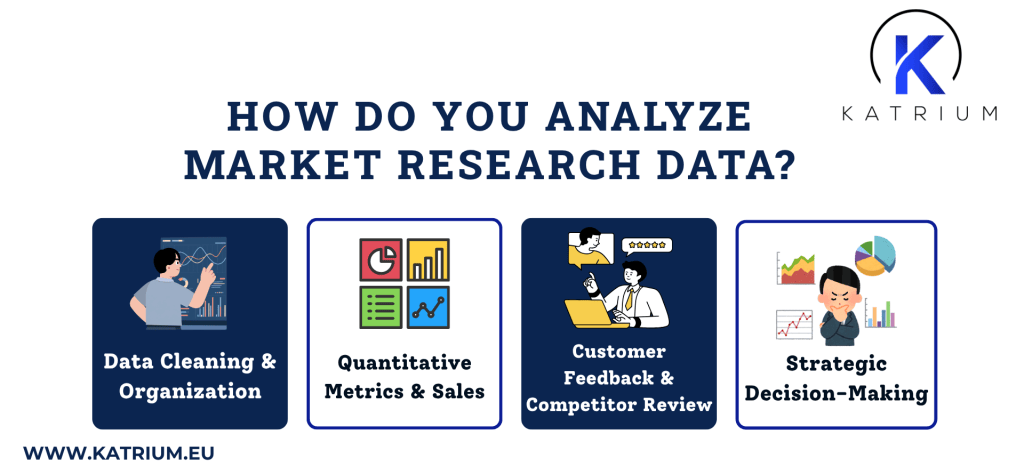
Raw data is generally unorganized and therefore not very helpful. When the information is divided into several sheets in an Excel file, it is challenging to grasp the exact reality. The first answer to “how do you analyze market research data?” is straightforward: organize it first before anything else. Businesses can better understand their clients, competitors, and market by applying market data analysis.
Before an organization uses market data, it is critical that it thoroughly scans the information for accuracy. Survey responses will most likely have repeated answers, missing data, and spelling mistakes. The first thing that one should learn when collecting primary data is how to do so effectively. This way, even the initial answers and responses are accurate and structured from the beginning. One of the easiest steps is writing product names in consistent ways. Another is dividing customer comments from the numerical responses. This eases the process of going over and reviewing the information and reduces mistakes in the analysis process. Removing blank answers also helps in the long run by keeping the final file neat while avoiding errors.
Evaluating Quantitative Figures and Customer Segments
When the data is clean and organized, the business is ready to look at simple numbers. These include customer ratings, sales figures, or traffic to a website. Quantitative research is often used as the main framework by businesses to interpret these patterns, numbers, and quantities.
Simple figures can be used to determine which products are selling well while indicating areas that require improvement. By identifying various customer segments, businesses can also learn about the differences in their comments and points of view. For example, younger customers may pay more attention to discounted prices and trends. Older customers may care more about exceptional quality with prompt customer service. Answers can be arranged by age group or by city to figure out what categories of customers purchase the most.
Read Qualitative Comments Beyond the Numbers
Customer comments offer details about the customers beyond the numbers and figures. When customer responses repeatedly show the same problems, such as high prices and delivery delays, these indicate areas needing improvement. These types of comments and details make it much simpler to learn what buyers want to see.
One of the best ways to get a new perspective on one’s position in the market is to look at what the competition is doing. Even though you may already be content with the results you are getting, it is possible that the other players are doing a better job than you are. This often highlights new areas and opportunities to explore and focus on. It is also a good idea to stay updated through various industry and research platforms, such as Market Research World. It will provide a much broader context to keep up with international benchmarks as well as consumer shifts and trends. Anyone who is trying to learn more about how to analyze market research data should always keep in mind that the numbers will tell you if there is a problem or not. But customers’ words will tell you why that may be. One should also look at other companies’ webpages to see what their customers are saying about them. This will help businesses find out what their competitors are doing wrong and what they can do better.
Turn Data into Strategic Business Decisions
Working on data takes time and energy. There are times that some organizations may not have sufficient staff and expertise to get through it during working hours. So they often decide to get outsourcing help when there is too much work to do. Katrium’s data processing services help businesses work through messy survey answers and spreadsheets to create clear and organized reports.
Final Thoughts: How Do You Analyze Market Research Data?
Data can only become meaningful when used for decision making. Every business can utilize its findings to improve products, set pricing, or plan for marketing activities. A company can successfully keep up with the ever-changing consumer taste and trends in its industry when it regularly and effectively analyzes its market research data. Consequently, the team is able to make more informed decisions instead of guessing. And when everyone is aware of the things that they need to work on, it makes the tasks they have a lot easier. In the end, buyer satisfaction and higher sales are the end results of the strategy’s implementation.
If you are still curious about how you analyze market research data when your team has no time for it, the market research team at Katrium can help you do it. Reach out to Katrium to learn more about what we can do to collect, clean and analyze your data for you.